Data modeling LGBTQ+ rights around the world

June is LGBT Pride Month.
If you’re reading this in the West, this is unlikely to have escaped your notice; companies across the internet have proudly changed their corporate colours in their tens of thousands and are publishing supportive feelgood stories on their social media channels left, right and centre.
We don’t disparage this. And Solidatus is no different: this time last year we published blog posts that looked at the foundations of the pride movement and sought the perspectives of a couple of our colleagues from the LGBTQ+ community:
- In Equality in tech still has further to go, we reviewed the history from the birth of Pride through to where we were in the tech sector of 2022.
- And we interviewed executive assistant Tamaryn Kraleva-Greener and software developer Samuel Trew.
This year, though, we thought to ourselves: we have some cool software that can model data and systems, their data lineage and offer all sorts of other insights from active metadata, as used for data governance and other use cases in banking, finance and beyond. But what if we make some interactive models of the LGBTQ+ landscape so we can bring something new to this space?
Well, following our success last month in modeling Eurovision data from 1956 onwards, we’ve done just that.
We drew this information semi-automatically from the sources shown below, something that our connectors hugely simplify. And then we adjusted it to elevate stories that speak for themselves.
So, come with us and take a look!
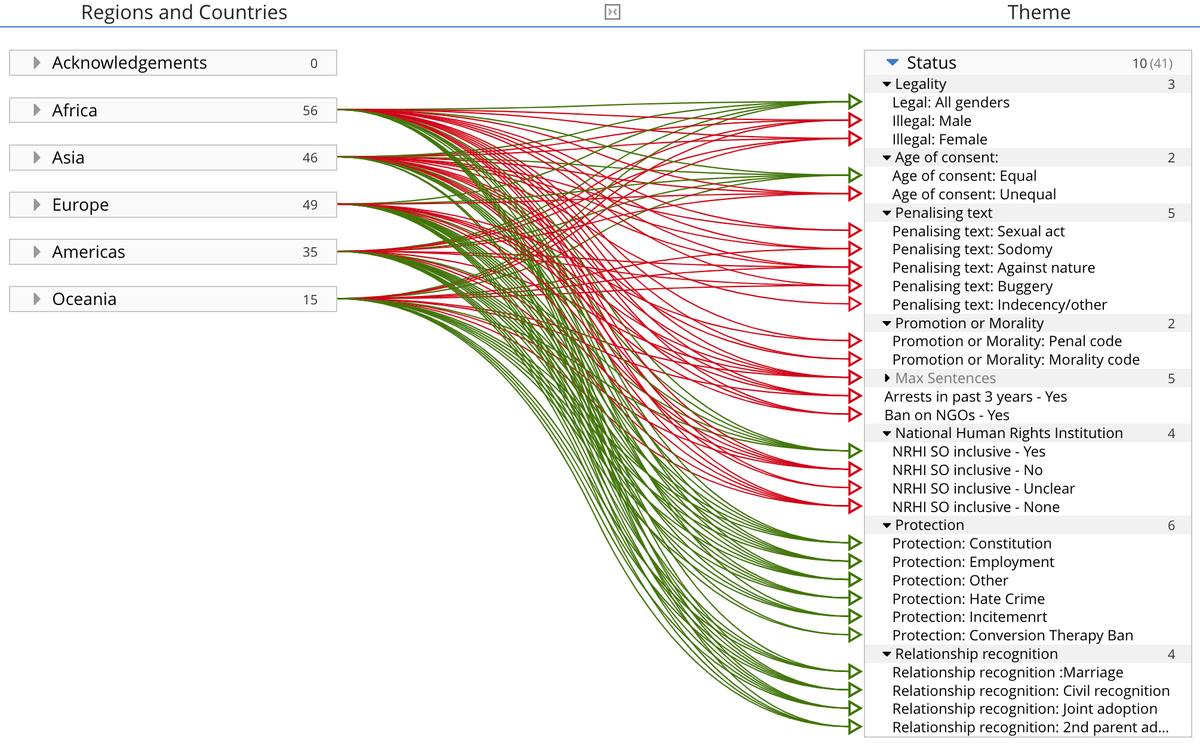
In this model, we provide a detailed view of different countries’ LGBTQ+ laws, with green and red transition lines indicating whether those rules and permissive or restrictive respectively. Click on the dropdown arrows next to a continent’s name to view info on individual countries, each of which you can click on. (This data was drawn from the International Lesbian, Gay, Bisexual, Trans and Intersex Association (ILGA) via data.world, as detailed in the ‘Inspector’ panel when you click on ‘Acknowledgements’.)
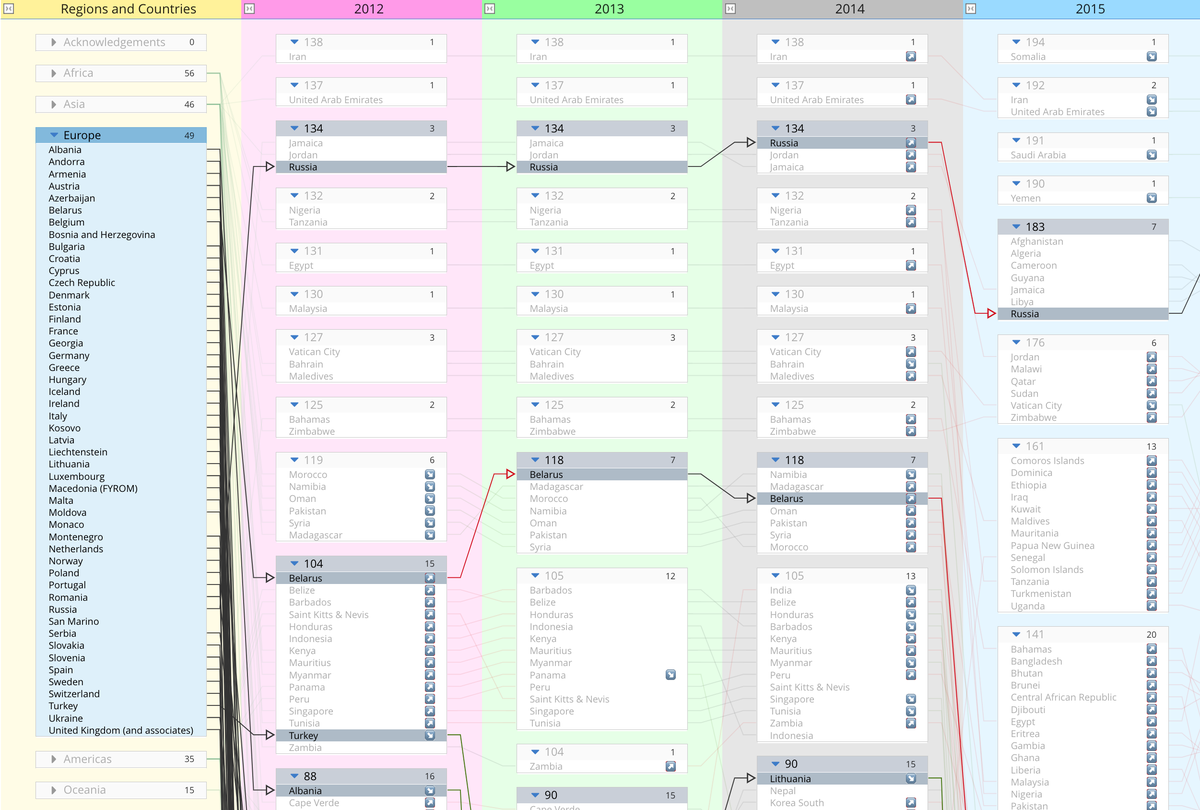
In this model, we provide a view on different countries’ evolving travel ratings from 2012 to 2021. The lower the number is in the top left-hand corner of the country’s card, the more openly LGBTQ+ people can be when they travel. (This data was also drawn from data.world, as shown in the equivalent ‘Inspector’ panel.)


Interesting info, we hope you agree, and even if you don’t, we wish you, the whole LGBTQ+ community and all of its many millions of allies a very happy Pride Month.
For more guidance on how to read Solidatus models, there’s a handy primer in our Eurovision blog post under the ‘A note on Solidatus models’ heading.
This article was written with the help of our data lineage software.


